始终心怀想念,振翅高飞,博客迎来了两百篇的光华。
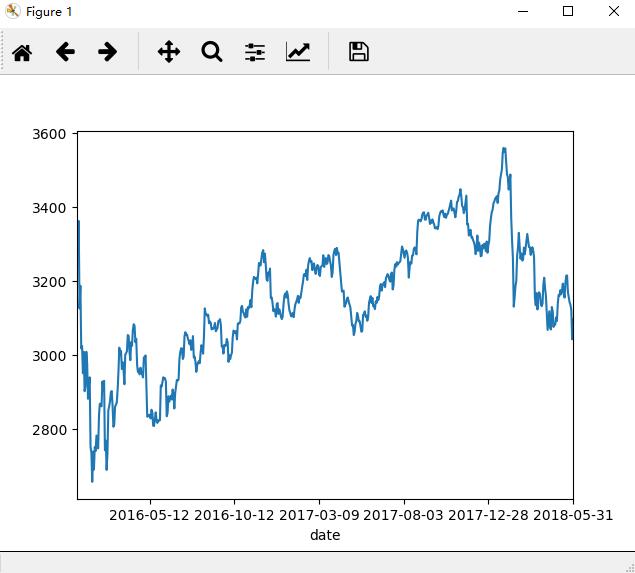
Tushare负责获取数据,存取到excel表格,Matplotlib负责华丽的显示。这篇博客将使用tushare获取上证000001指数,将其存入excel并绘制曲线图。
因为python的简介,这篇博客非常简短,不用解释,每一行都能看懂。
代码:
import tushare as ts
import matplotlib.pyplot as plt

df = ts.get_hist_data('sh', start = '2016-01-01')
df.to_excel('stock_sh.xlsx')
df.close.plot()
ax = plt.gca()
ax.invert_xaxis()
plt.show()
结果图:
OK,See You Next Chapter!