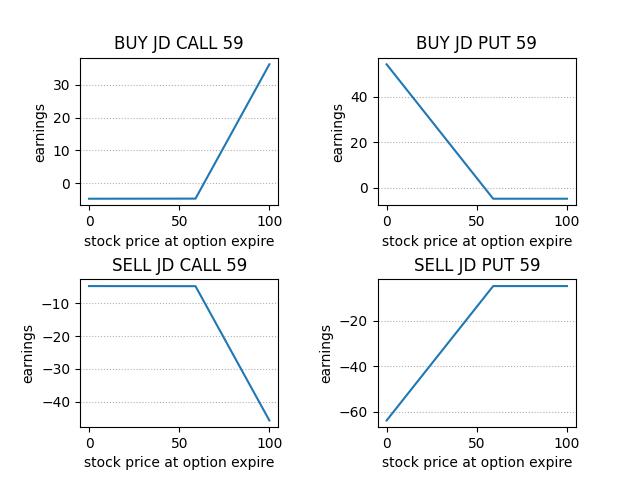
我们都熟悉期权有四个交易方向Buy Call,Buy Put,Sell Call,Sell Put,这篇博客主要用python计算这些基本交易方向的投资收益。
四个基本操作方向,在期权到期日的盈亏如下图(我们以JD CALL 59 为例):
就一个函数,比较简单,直接贴代码了
import numpy as np
import matplotlib.pyplot as plt
from types import SimpleNamespace


def calc_option_earnings(tic_price, option, operation='buy'):
    """
    :param tic_price: scalar or 1D array, stock price at option expire
    :param option: option info, contail following field
           option = SimpleNamespace()
           option.name = 'JD CALL 59'
           option.price = 4.75
           option.exercise_price = 59
    :param operation: 'buy'  'sell'
    :return: scalar or 1D array, earnings
    """

    # exercise inner value
    value_option = tic_price
    if 'call' in option.name.lower():
        value_option = np.maximum(0, tic_price - option.exercise_price)
    if 'put' in option.name.lower():
        value_option = np.maximum(0, option.exercise_price - tic_price)
    if 'sell' in operation.lower():
        value_option = -value_option

    earnings = value_option - option.price

    return earnings


def test_options():
    option_call = SimpleNamespace()
    # option info at 2022-04-29
    option_call.name = 'JD CALL 59'
    option_call.price = 4.75
    option_call.exercise_price = 59

    # exercise price at option expiry
    tic_price = np.arange(0, 100, 0.01)

    # calc earning
    earnings_buy_call = calc_option_earnings(tic_price, option_call, 'buy')
    earnings_sell_call = calc_option_earnings(tic_price, option_call, 'sell')

    option_put = SimpleNamespace()
    # option info at 2022-04-29
    option_put.name = 'JD PUT 59'
    option_put.price = 4.75
    option_put.exercise_price = 59

    # calc earning
    earnings_buy_put = calc_option_earnings(tic_price, option_put, 'buy')
    earnings_sell_put = calc_option_earnings(tic_price, option_put, 'sell')

    # plot
    plt.figure()
    plt.subplots_adjust(left=None, bottom=None, right=None, top=None,
                wspace=0.5, hspace=0.5)
    plt.subplot(2, 2, 1)
    plt.plot(tic_price, earnings_buy_call)
    plt.title('BUY ' + option_call.name)
    plt.xlabel('stock price at option expire')
    plt.ylabel('earnings')
    plt.grid(axis='y', linestyle=':')

    plt.subplot(2, 2, 2)
    plt.plot(tic_price, earnings_buy_put)
    plt.title('SELL ' + option_put.name)
    plt.xlabel('stock price at option expire')
    plt.ylabel('earnings')
    plt.grid(axis='y', linestyle=':')

    plt.subplot(2, 2, 3)
    plt.plot(tic_price, earnings_sell_call)
    plt.title('BUY ' + option_call.name)
    plt.xlabel('stock price at option expire')
    plt.ylabel('earnings')
    plt.grid(axis='y', linestyle=':')

    plt.subplot(2, 2, 4)
    plt.plot(tic_price, earnings_sell_put)
    plt.title('SELL ' + option_put.name)
    plt.xlabel('stock price at option expire')
    plt.ylabel('earnings')
    plt.grid(axis='y', linestyle=':')

    plt.draw()

    return


if __name__ == "__main__":
    test_options()
量化投资代码库:
Dark Mode

QIAT (this link opens in a new window) by P-Chao (this link opens in a new window)
Quantitative investment analysis tools